MCP insights
The MCP insights dashboard helps you understand how your organization uses Glean's MCP servers across connected host applications. You can track adoption trends, identify top applications, and drill down into usage by users, tools, and servers.
Prerequisites
Complete the following prerequisites:
- Have the Insights Moderator role to access this feature. Users with the MCP Server Moderator role can access MCP insights only. See MCP Server Moderator.
- Turn on the Glean OAuth authorization server in Admin console → Users & permissions → Third-party access (OAuth).
- Turn on the Glean MCP server in Admin console → Platform → Glean MCP server.
MCP usage data appears only after you turn on both servers. For setup instructions, see Set up Glean MCP server.
To open the MCP insights tab, click your profile in the lower-left corner, then select Insights → MCP insights.
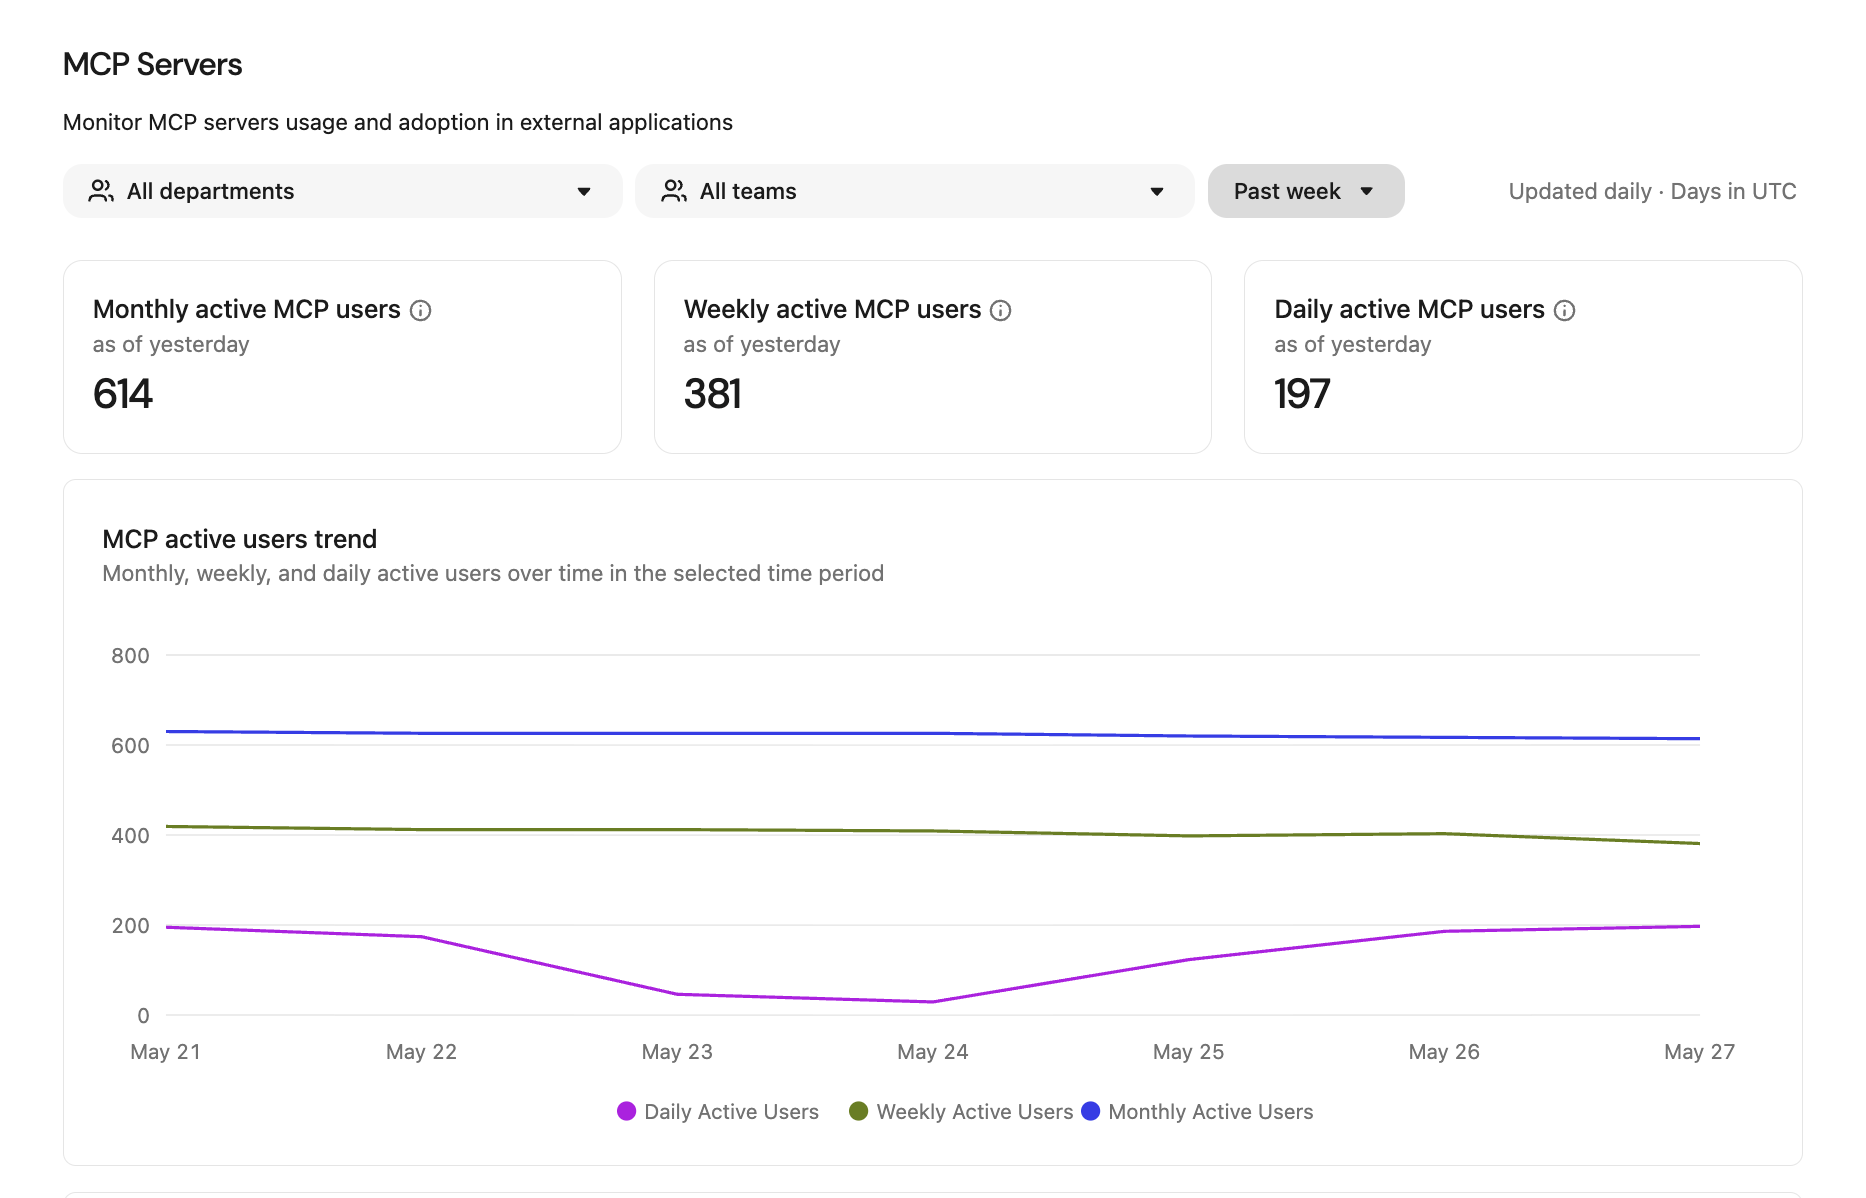
Filters
All charts and tables on the dashboard respond to global filters at the top of the page:
- Department: Scope data to one or more departments from your org chart.
- Team: Scope data to the direct and indirect reports of selected teams.
- Time range: Choose a preset period (for example, Past week) or set a custom date range to control the reporting window.
The Department and Team filters are mutually exclusive. Selecting one clears the other.
If plug-in events are included in the MCP Insights dashboard of your organization, activity from Cursor, Claude Code, and Codex appears alongside standard MCP server usage. Use the host, user, tool, and time filters to isolate plug-in activity. See Manage Glean plug-in access and security and Glean Plugin for Codex.
Summary statistics
Three headline metrics appear at the top of the dashboard:
| Metric | Definition |
|---|---|
| Monthly active users (MAU) | Distinct users who made at least one MCP call in the last 28 days. |
| Weekly active users (WAU) | Distinct users who made at least one MCP call in the last 7 days. |
| Daily active users (DAU) | Distinct users who made at least one MCP call in the last day. |
MCP active users trend
A line chart shows the trend of MCP active users across the selected time range. Use this chart to spot adoption momentum or usage dips.
MCP usage among Glean users
A bar chart compares daily MCP active users against overall Glean active users, so you can see what share of your user base has adopted MCP.
Each bar represents total Glean active users for that day, with the MCP-active portion filled in. Turn on Show adoption % to overlay a line that shows the MCP adoption percentage over time.
Active users by top host applications
A grouped bar chart shows the top three host applications by active user count in the selected time period. Use the granularity toggle to switch between Day, Week, and Month views.
Usage breakdown
A detailed table lets you explore MCP usage from four perspectives. Select a view using the tabs at the top of the table.
Table features
All breakdown views support the following features:
- Search: Filter rows by keyword.
- Sortable columns: Click a column header to sort ascending or descending.
- Pagination: Results display 10 per page.
- CSV export: Click the download button to export the current view as a CSV file.
By users
Shows individual user activity with the following columns:
| Column | Description |
|---|---|
| User | The user's name and profile. |
| Total calls | Number of MCP calls this user made. |
| Host applications | Host applications the user connected through. |
| MCP tools | MCP tools the user invoked. |
| MCP servers | MCP servers the user connected to. |
You can filter by Application, Tool, or Server using the multiselect dropdowns above the table.
By applications
Shows usage grouped by host application:
| Column | Description |
|---|---|
| Host application | The name of the MCP host application. |
| Active users | Number of distinct users on this application. |
| Total calls | Total MCP calls from this application. |
| Share of calls (%) | This application's percentage of all MCP calls. |
By MCP tools
Shows usage grouped by MCP tool:
| Column | Description |
|---|---|
| MCP tool | The name of the tool. |
| Active users | Number of distinct users who invoked this tool. |
| Total calls | Total invocations of this tool. |
| Host applications | Host applications that invoked this tool. |
You can filter by Application using the dropdown above the table.
By MCP servers
Shows usage grouped by MCP server:
| Column | Description |
|---|---|
| MCP server | The name of the server. |
| Active users | Number of distinct users who connected to this server. |
| Total calls | Total calls routed through this server. |
| Host applications | Host applications that connected to this server. |
You can filter by Application using the dropdown above the table.