AI Security Insights
The AI Security Insights dashboard gives administrators a high-level view of AI security activity across Glean Assistant and agents. Use it to spot trends, understand which policies are detecting issues, and identify areas that need attention.
To access the dashboard, navigate to Admin console → Protect → AI security and click Insights.
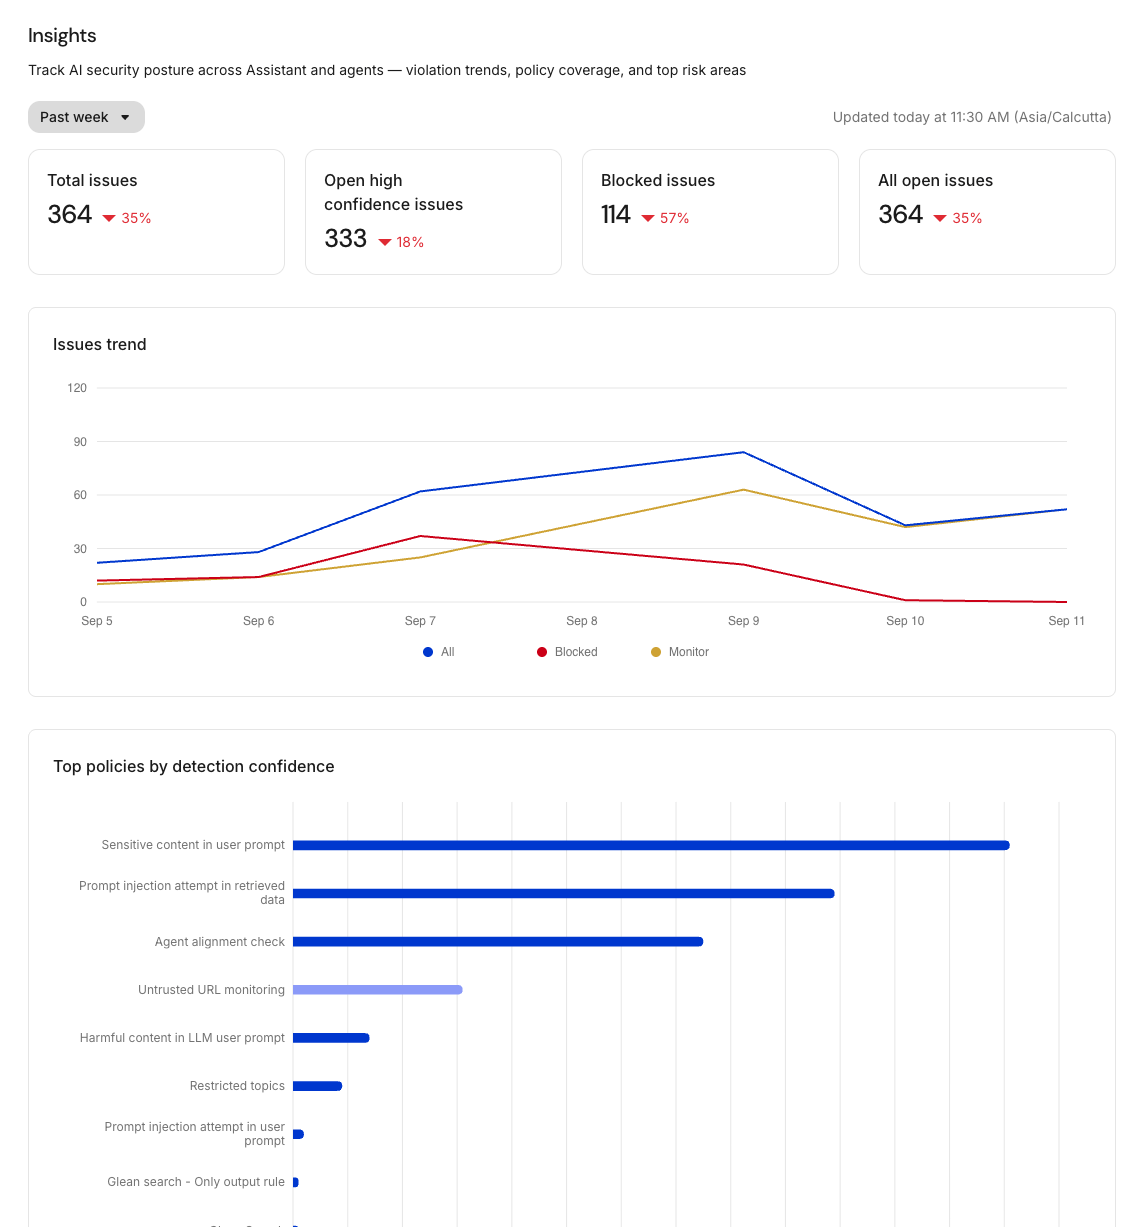
AI Security Insights dashboard with the Past week selector, overview cards, Issues trend chart, and policy confidence chart
Choose a time window
Use the time window selector to change the period shown across the dashboard:
- Past week
- Past month
- Past 6 months
The Updated at timestamp shows when the dashboard data was last refreshed.
Read the dashboard
Learn how to understand the charts, cards, and views presented by the AI Security Insights dashboard.
Interpret overview cards
The overview cards provide a quick summary of the selected period:
- Total issues: The total number of issues detected.
- Open high confidence issues: Open issues with a high-confidence detection.
- Blocked issues: Issues for which Glean blocked the interaction.
- All open issues: Issues that still need review.
Use these cards to compare the overall volume of activity with the issues that require the most immediate attention.
Read the Issues trend
The Issues trend chart shows how issue activity changes over time. Compare the lines for all issues, blocked issues, and monitored issues to understand whether activity is increasing, decreasing, or changing in severity.
Review top policies by detection confidence
This chart ranks policies by detection confidence for the selected period. Use it to see which policies are contributing the strongest signals and where policy activity is concentrated.
Review top topics detected
Top topics show the themes most often associated with detected issues. Use this view to identify recurring risk areas and decide where to focus policy or agent reviews.
Compare issues by agent
Issues by agent groups detected issues by agent. Use it to identify agents with higher issue volume and prioritize follow-up or policy review.
Review issues by users
Issues by users shows where detected issues are concentrated across users and departments. Use it to understand who may need additional guidance or investigation.
Investigate individual issues
Use the Insights dashboard to identify trends and priorities, then open the Findings Dashboard to review individual issues and investigate their details.
For information about creating or updating the policies that generate issues, see Configuring Policies.