Manage connector settings and visibility
Use this page after you add a connector and begin setup. Once a connector exists, the Admin console shows tabs you can use to monitor sync progress, update settings, control visibility, and access connector-specific options.
The tabs that appear depend on the connector type and the current setup state. Some tabs appear as soon as you add the connector, while others appear only after setup is complete or additional features are enabled.
This page explains what each tab does, when it appears, and when to use it. To open an existing connector, go to Admin console > Connectors and select the connector.
Overview tab
The Overview tab is the default view for a connected connector. Use it as a first stop to verify that the connector is running and progressing.
Sync status
During initial sync, the Overview tab shows two phases:
- Crawling: the connector is actively fetching content, metadata, and permissions from the source system. The Items synced count should increase over time.
- Indexing: the connector is processing crawled content and incorporating it into the Knowledge Graph.
Once both phases complete, the connector enters steady state and processes incremental updates through webhooks and periodic crawls.
Key metrics
| Metric | Description |
|---|---|
| Items synced | Total items fetched from the source. Refreshes hourly. Should increase steadily during initial sync. See Crawling FAQ for expected timelines. |
| Crawl rate | Hourly rate of crawling tasks across document parts (content, metadata, permissions) during initial crawl. Acts as a heartbeat — if it flatlines, investigate connector health. See Crawling strategy for how Glean optimizes crawl scheduling. |
| Change rate (items/day) | Creates, edits, permission and metadata changes, and deletes synced in the past 24 hours. Available after initial sync completes. See Crawling strategy for details on incremental updates. |
Crawl rate and Change rate are not available for federated-only, customer-managed, or web history connectors. Permission and metadata updates can inflate the change rate even when no new items are added. For more on connector data access modes, see Connector data access modes. To understand how these metrics signal problems, see Monitor connector health and alerts.
Signs of a problem
- Items synced stops increasing for 24 or more hours during initial sync — verify connector permissions, API throttling, or configuration issues.
- Change rate is 0 for an extended period when you expect activity — check webhook or incremental crawl health.
- A connector remains in Indexing for multiple days with no progress — contact Glean Support.
Search results
The Overview tab includes a Search results section that controls whether the connector appears in Glean search:
- Add to search results: all eligible users see content from this source (subject to source permissions).
- Limit to test group: only members of the assigned test group see results. See Visibility and test groups below.
- Remove from search results: users don't see content from this source.
Content overview
Clicking into a connector also shows a breakdown of indexed content by document type. For example, a Dropbox connector might show counts for Folder, Document, Spreadsheet, Paper, and Video.
Extreme measures
At the bottom of the Overview tab is a collapsible Extreme measures section. It provides high-impact tools:
- Stop crawl: stops all ongoing crawls for the connector. Available for most connectors. Use this when a crawl is causing issues (for example, API throttling or incorrect data) and you need to pause while you investigate.
- Delete instance: permanently removes the connector and all indexed content. Documents may take up to 5 minutes to disappear from search results. Glean removes all associated data in the background.
You cannot easily reverse these tools. Deleting a connector requires you to go through the full setup process again. Stop crawl may require Glean support to restart in some cases.
Limitations:
- Connectors that do not support multiple instances (for example, Outlook) may not show the Delete instance option.
- You cannot delete your active People connector — set a new one first.
- Some Slack instances only show Stop crawl under Extreme measures.
For more information, see Crawling FAQ.
Setup tab
The Setup tab contains the connector-specific configuration flow — credentials, OAuth, workspace settings, and other parameters required to connect the connector. Each connector documents its own setup steps. Refer to the connector's setup page for details.
After initial setup, you can return to this tab to update credentials, reconfigure authentication, or modify connector-specific parameters.
Manage data tab
Some connectors provide a Manage data tab for controlling which content is crawled and indexed. Not all connectors have this tab — if yours does not, contact Glean support for backend configuration options.
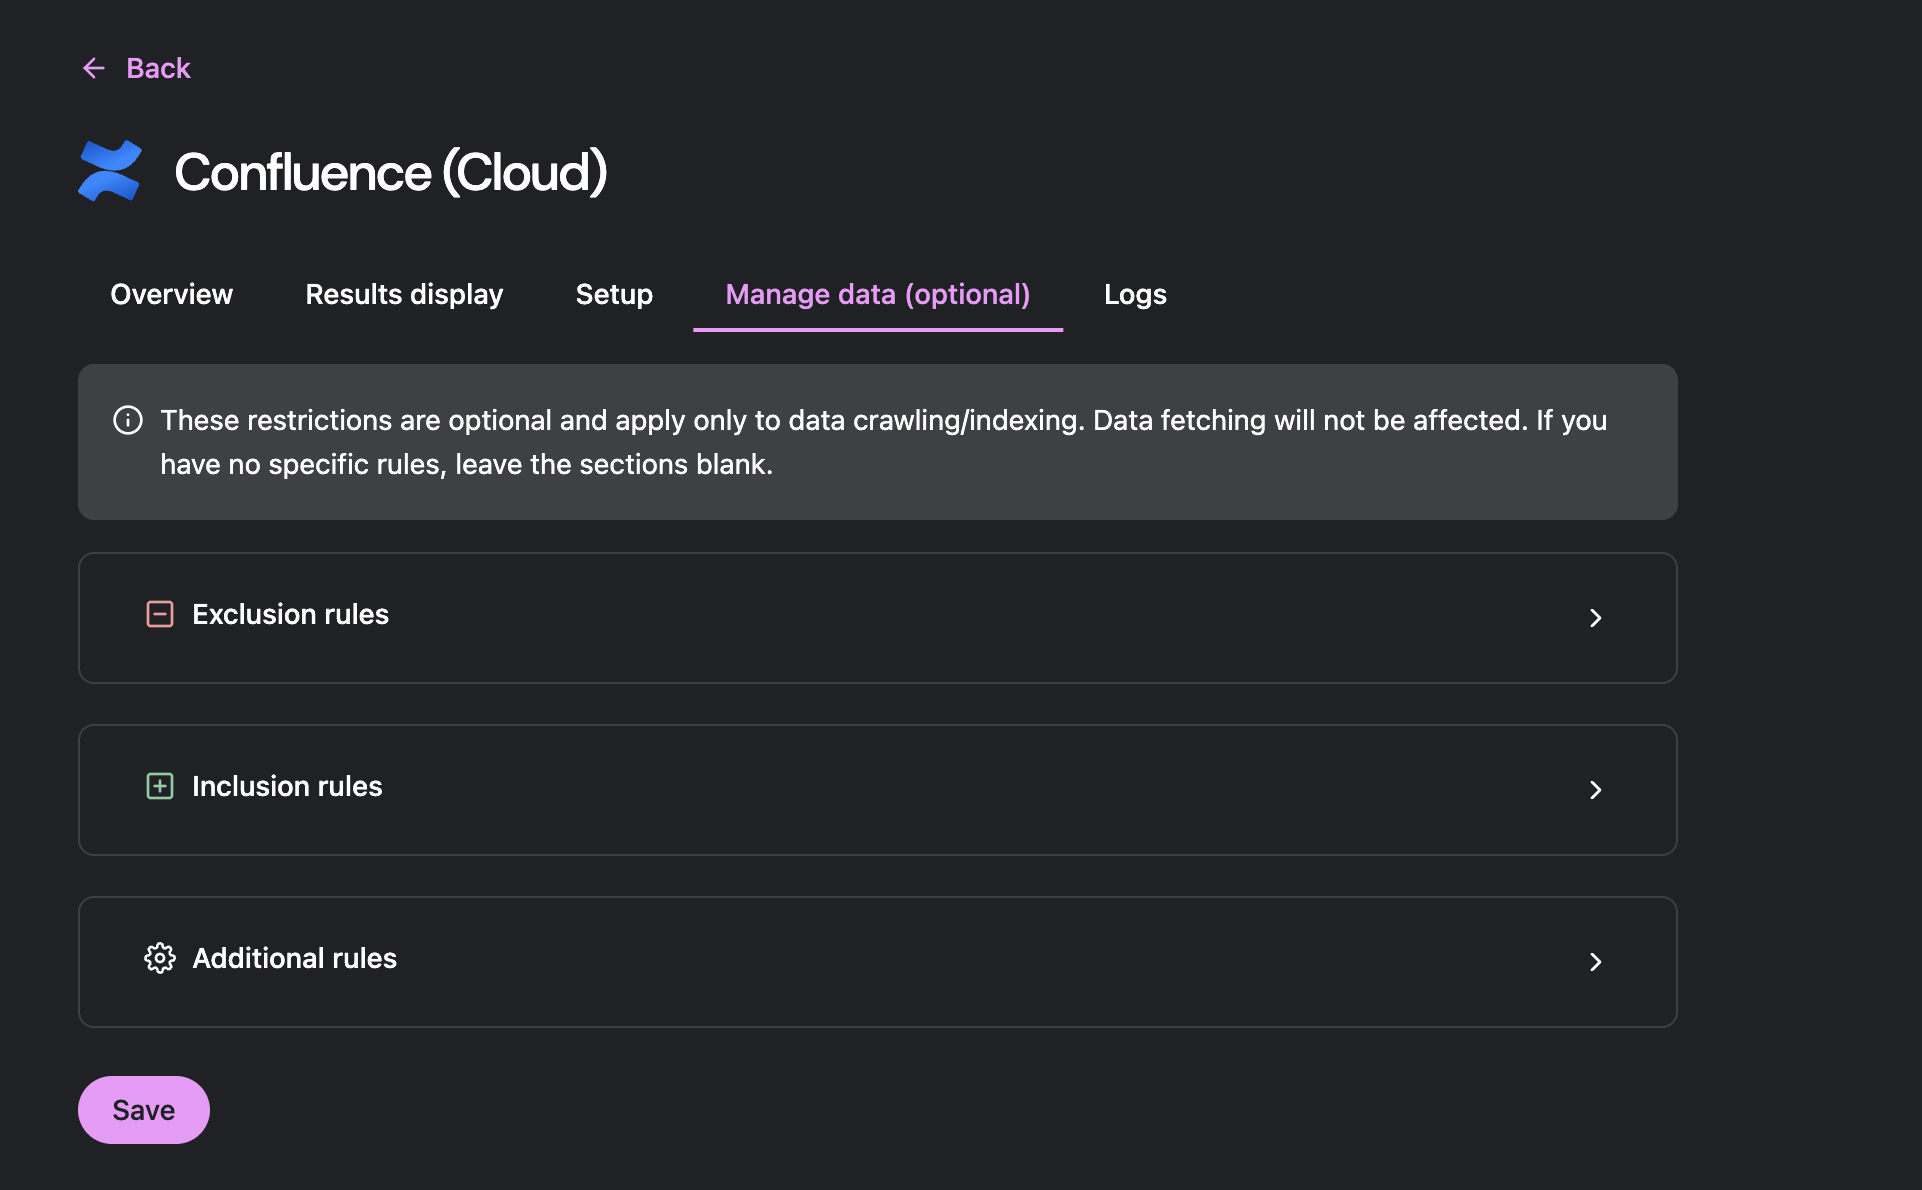
Inclusion rules (greenlisting)
Inclusion rules specify exactly which content to crawl. When you add inclusion rules, Glean only crawls the listed items. Examples:
- Specific Slack channels
- SharePoint site URLs
- Google Drive shared drive IDs
- Confluence spaces
Exclusion rules (redlisting)
Exclusion rules remove specific content from crawling. If both inclusion and exclusion rules apply to the same content, exclusion takes priority — Glean does not index the content. Examples:
- User IDs or email addresses
- Folder paths
- Channels or spaces containing sensitive data
- Google Drive sensitivity labels
Content type filters
Some connectors let you filter by content type — for example, crawling only specific file types or object categories.
Use inclusion and exclusion rules sparingly. Most customers do not apply any rules, or apply exclusion rules only for sensitive data. Broad exclusions can reduce the quality of the enterprise search experience.
Connector-specific behavior:
- Gmail — manage data restrictions apply only to data crawling and indexing, not to data fetching (federated search).
- Google Drive — supports exclusion by shared drive IDs, folder paths, user email addresses, and Drive sensitivity labels.
- Google Chat — configure crawl toggles for DMs, group chats, and bot messages.
- Seismic — use the Manage data tab to greenlist specific file extensions.
For details on inclusion and exclusion rules, see Excluding content.
Result display tab
The Result display tab controls how items from a connector appear in Glean search results. You can customize the metadata fields shown on result cards, such as title, author, date, and other source-specific fields.
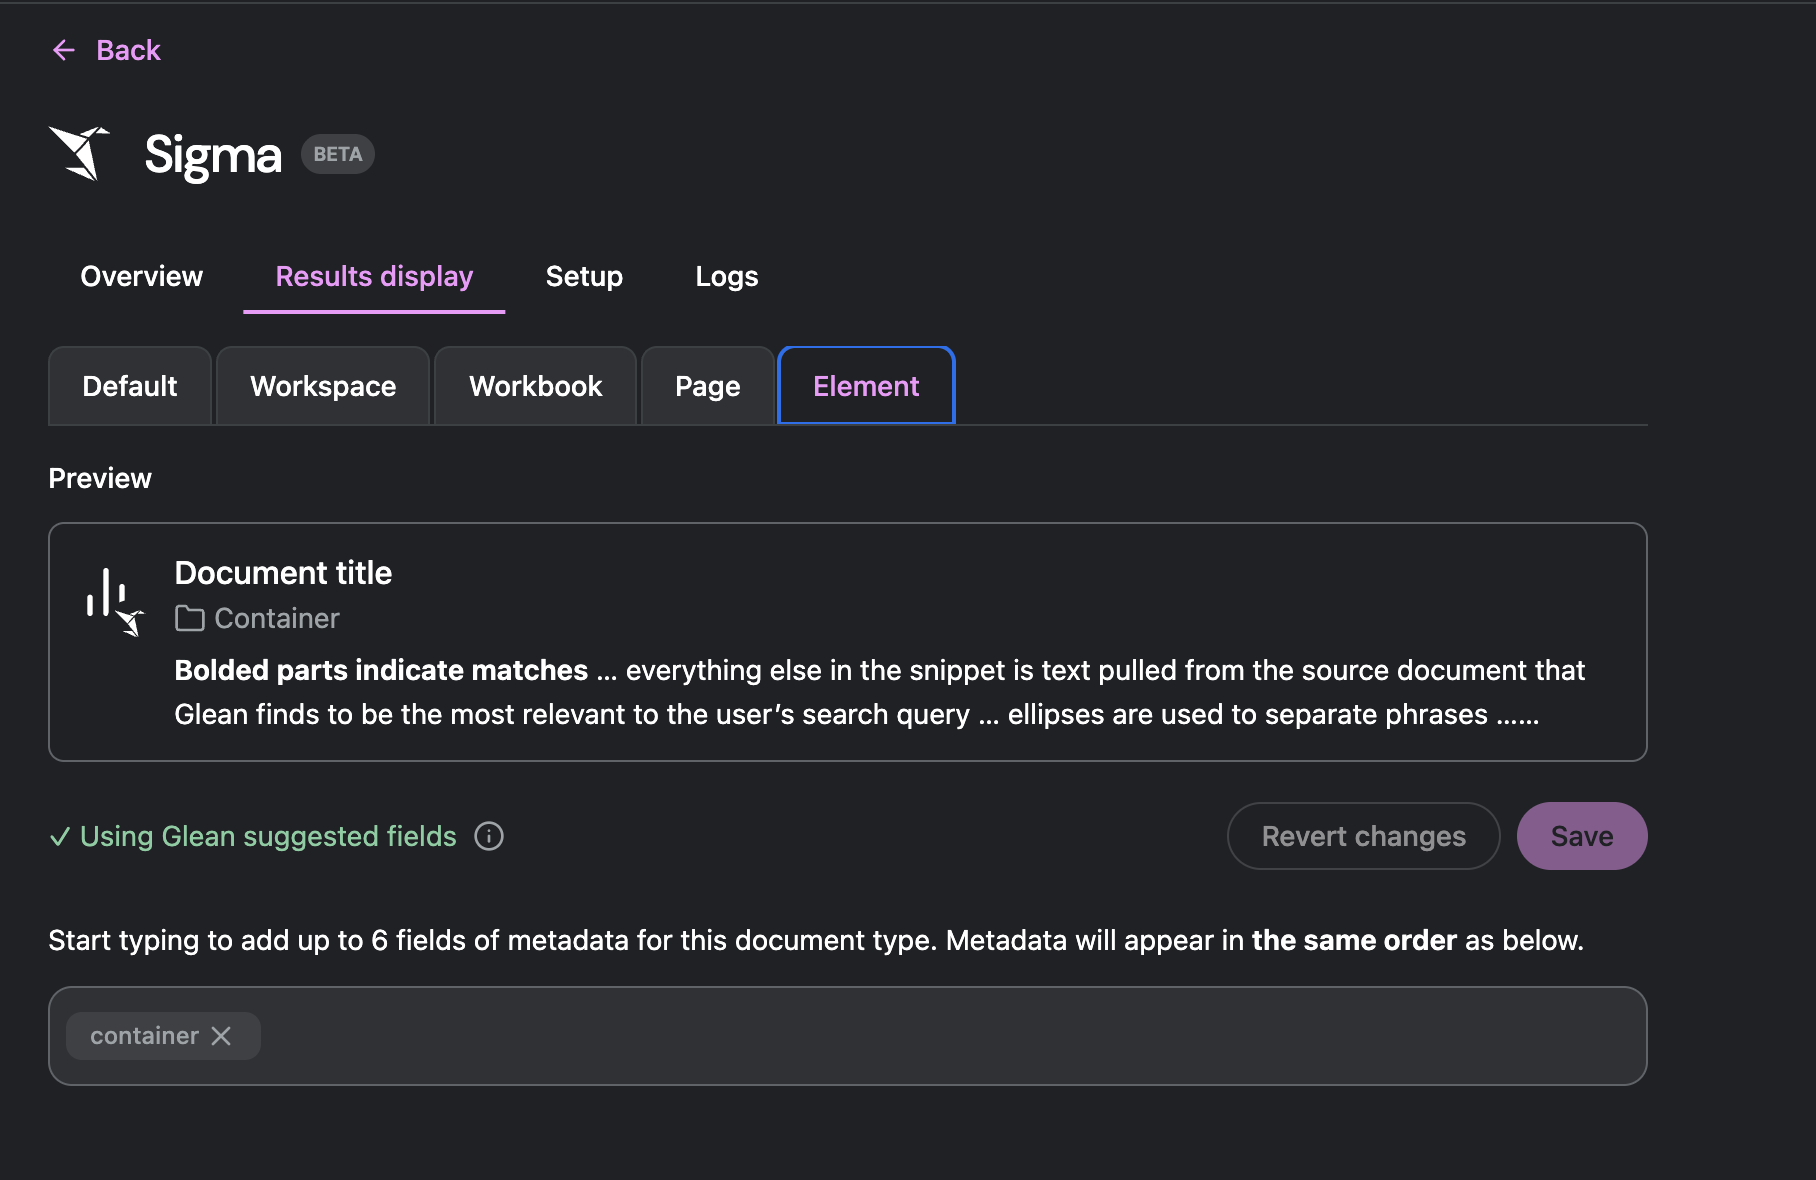
What you can configure
- Select up to 6 metadata fields to display on search result cards.
- Configure display settings for each object type — for example, a Salesforce connector can have different display settings for Deals, Accounts, and Contacts.
- Reset to Glean defaults at any time.
When the tab appears empty
For custom connectors (Push API connectors), the Result display tab is blank until you create object definitions for the connector. You configure display settings per object type.
For more information on custom connector configuration, see REST APIs FAQ.
Tools tab
For connectors that support Glean tools, the Tools tab lets you configure what tools the Assistant and agents can use in the connected app. This tab appears after the connector setup is complete.
Tools let agents perform operations like creating tickets, sending messages, or updating records in the source system. The same flow supports both native tools and Model Context Protocol (MCP) tools.
For details, see Configure tools in connector setup.
Logs tab
The Logs tab displays an audit trail of configuration changes for the connector. It appears after your workspace launches.
What the logs show
Each log entry includes:
| Field | Description |
|---|---|
| Timestamp | When the tool occurred. |
| Actor | The user or system that performed the tool. |
| Tool | What was changed (for example, credentials updated, visibility changed). |
| Result | Whether the tool succeeded or failed. |
Filtering and export
- Filter by email address, time period (last 7 days, last 30 days, etc.), actor type (user, setup admin, system), or result (succeeded, failed).
- Export logs as CSV (up to 10,000 rows).
- Glean retains logs according to data retention policies (typically 90 days).
For workspace-wide audit logs, see Admin console → Management → Audit logs.
Visibility and test groups
Visibility controls let you limit who sees indexed content during rollout. This is useful when validating a new connector before making it available to all users.
Set connector visibility
From the Overview tab's Search results section, choose one of:
- Visible to everyone — all users with source permissions see results.
- Visible to test group only — only members of the assigned test group see results.
- Not visible — no users see results from this source.
Create and manage test groups
Test groups let you validate content and permissions before a broad launch.
- Go to Admin console → Connectors → Manage test groups.
- Create a test group and add members — individual users or identity provider groups (Azure AD or Google Groups).
Test group limits:
- Up to 10 test groups per workspace.
- Up to 1,000 users or groups per test group.
- Membership changes can take up to 30 minutes to propagate.
- You cannot delete a test group assigned to a connector until you reassign it.
Recommended rollout process
- Set visibility to Visible to test group only during initial sync and validation.
- Assign a test group (for example, "POC Admins" for initial testing).
- Let the test group verify search results, content accuracy, and permissions.
- Expand to a broader group (for example, "Beta Users") if needed.
- Set visibility to Visible to everyone once validation is complete.
You can create multiple test groups to manage different rollout phases. Each connector can be assigned to a specific test group.
For detailed guidance, see Managing result visibility.