Inline artifacts in Glean
When you ask for a chart or a diagram, Glean can render it as an interactive widget right inside the chat response.
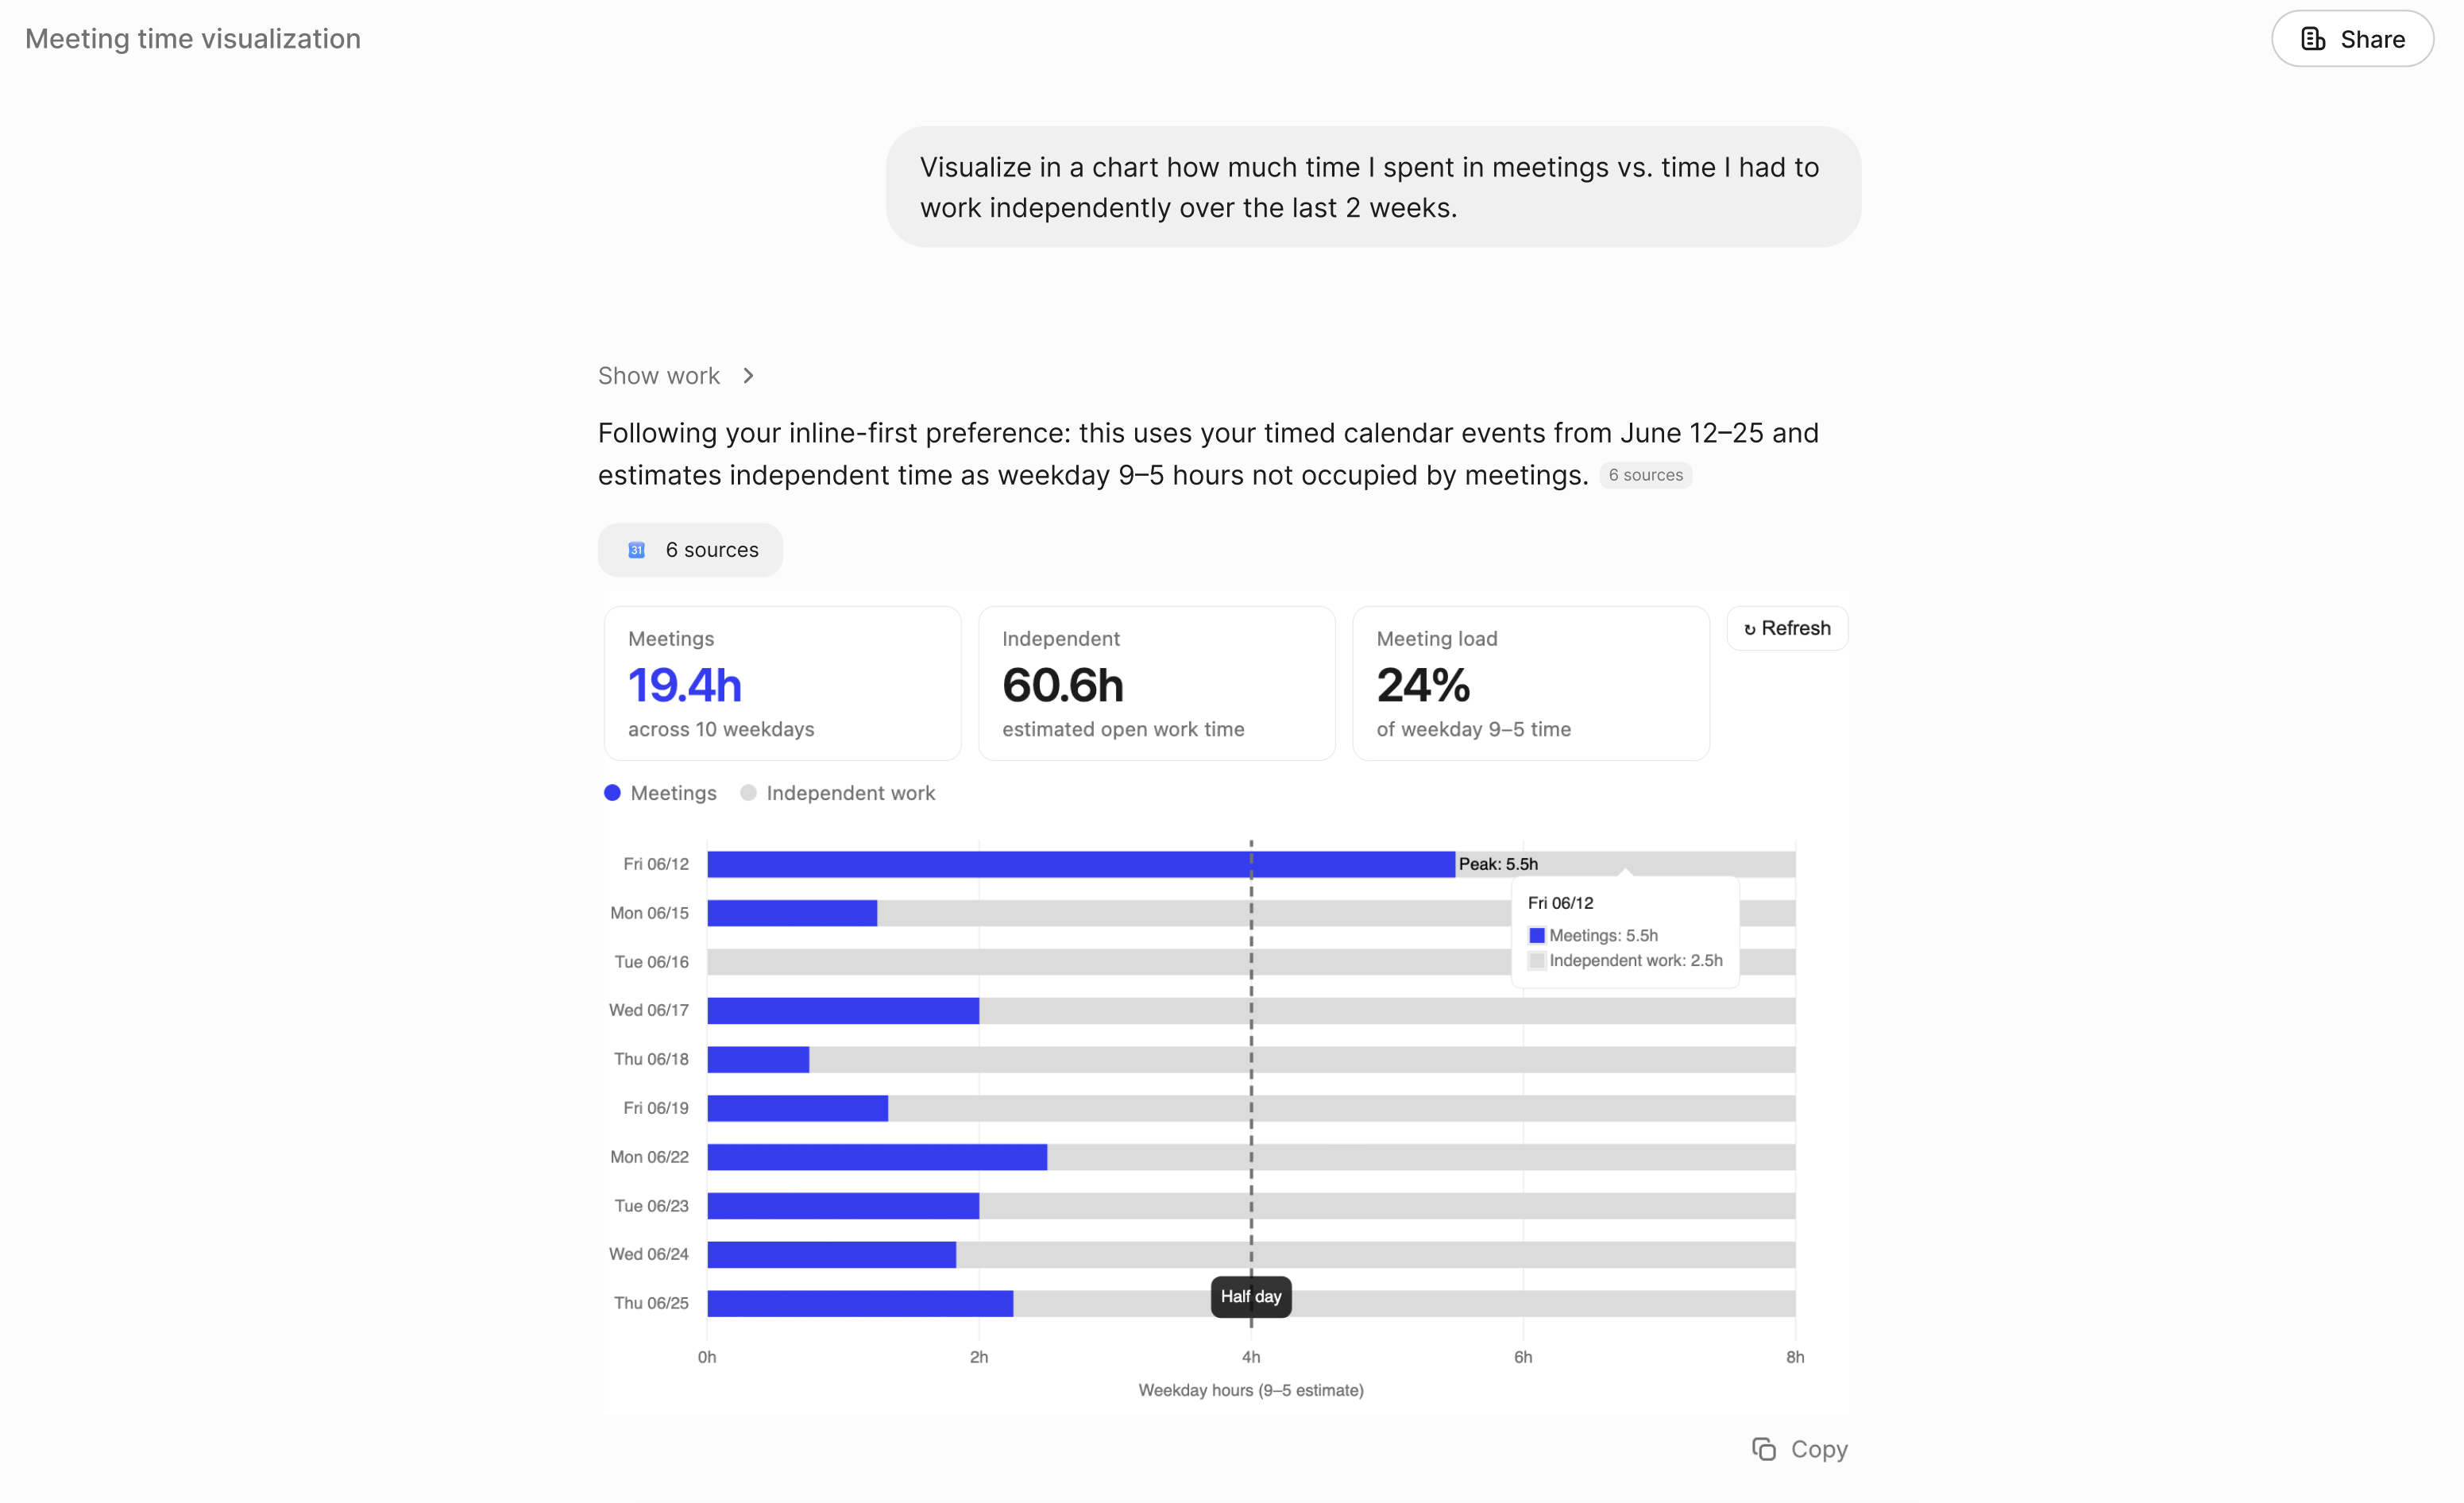
Glean answers a visual question with an interactive chart rendered inline in the chat response
Prerequisites
Inline artifacts are controlled by the Inline artifacts setting in the admin console. When the setting is on, Glean renders a chart or diagram inline whenever you ask for one. When it's off, Glean answers in text instead.
If you don't see interactive widgets inline with your responses:
- Your admin may not have turned on the Inline artifacts setting for your organization.
- Your browser may need a hard refresh after a recent rollout.
How inline artifacts work
Inline artifacts appear when you ask for a chart or a diagram — you don't need to switch modes or use a special command. Request the visual and Glean renders it directly in the response.
Ask for a chart or diagram
Ask Glean for the visual you want. For example: "Create a chart that compares last quarter's revenue across regions" or "Show our onboarding process as a flow diagram."
Glean renders an inline widget
Glean responds with a compact, interactive chart or diagram inside the chat, instead of describing the answer in text.
Interact with the widget
The widget stays interactive after the response finishes generating. You can hover over and explore the chart or diagram.
Copy as an image
Copy the widget's output as an image to drop into a document, slide, or message.
What Glean generates
When you ask for a visual, Glean produces:
- A small, self-contained interactive widget (a chart, diagram, comparison, or similar) rendered as an HTML component.
- A self-contained interactive chart or diagram rendered directly in the chat response.
- A widget you can save as a full interactive artifact in Canvas for further editing and sharing.
Use cases
Inline artifacts make charts and diagrams easy to request, including:
- Quick charts from live data: Visualize numbers Glean pulled during the same turn, such as revenue across regions or headcount by team.
- Trends and comparisons: Chart values over time or compare options side by side with bar, line, or pie charts.
- Process and concept diagrams: Turn a process, workflow, or framework into a flow diagram instead of a list of steps.
- Relationships and structures: Diagram how systems, teams, or steps connect.
Tips for better results
- Ask for the visual you want. Naming the format ("compare these as a bar chart" or "show this as a flow diagram") gives Glean a clearer target.
- Reference internal sources. Ask Glean to pull from specific documents, projects, or teams so the chart or diagram is grounded in real data.
Frequently asked questions
See also
- Interactive artifacts - Publish and share full interactive artifacts from Canvas with a stable link.
- Canvas - Learn about using Canvas for content creation.
- Best Practices - Tips for getting better results from Glean.