Frequently asked questions (FAQ)
To monitor your deployment's crawl health, go to Admin console → Platform → Connectors and review Status, Items synced, Crawl rate, and Change rate. See Managing connectors for details on interpreting these metrics.
Initial crawl duration varies significantly based on:
Connector size
The total volume of content — number of documents, messages, and their sizes — directly impacts crawl time.
API rate limits
The connector's API rate limit affects how quickly Glean can retrieve items. Lower rate limits result in longer crawl times.
Estimating crawl completion time
For select connectors, you can enter an estimated document count during setup to receive a projected time range based on historical crawl data. See How do I use initial crawl estimates? for a step-by-step guide. You can also monitor Crawl rate in the Admin console for a live view of initial sync progress.
For select connectors, Glean provides an optional crawl time estimate during setup based on historical crawl data. This helps you anticipate when initial sync will complete.
Open the Schedule first crawl tab
Navigate to the Schedule first crawl tab while adding a new connector.
Choose the crawl method
Choose between Crawl now or Do this later.
Select your estimated corpus size
Use the optional dropdown labeled Roughly how many items do you expect? to select the range that best fits your expected document count. Options are connector-specific and formatted as ranges (for example, 10,000–100,000), with the last segment open-ended (for example, 1,000,000+).
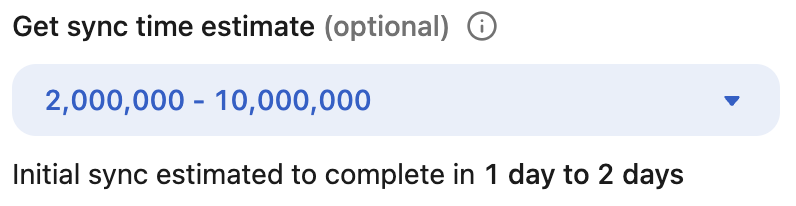
Get sync time estimate (optional)
After selecting a range, an estimated crawl duration appears below the dropdown — for example, Initial sync estimated to complete in 2 days.
How estimates are computed
Estimates are based on historical averages of past crawl durations for similar connectors and corpus sizes. They are shown in days and provide a broad time range, not a precise ETA. Actual crawl time can vary based on data volume, change frequency, API rate limits, and content structure.
Availability
Initial crawl estimates are not available for all connectors. In particular, they are not shown for:
- Atlassian connectors (Jira, Confluence, Bitbucket, Trello) — due to rate-limiting variability
- Slack and Slack Enterprise Grid — due to rate-limiting variability
No estimate is displayed if there is not enough historical data for a given connector.
Crawl duration is primarily determined by your connector's size. Larger datasets or applications with low API rate limits naturally require more time to process. If your crawl duration exceeds expectations, we recommend contacting Glean support for assistance.
Monitor crawl status under Admin console → Platform → Connectors:
- Initial sync in progress: Indicates an active crawl
- Crawling: Indicates content collection
- Indexing: Indicates making the content searchable
- All connectors → Items synced: Indicates a completed crawl
During initial sync, use Crawl rate (parts/hour) to confirm the crawl is progressing. After initial sync completes, use Change rate (items/day) to confirm ongoing freshness.
For select connectors, you can also get an initial crawl estimate during setup.
Crawl rate is the hourly rate of crawling tasks across document parts, for example, content, metadata, permissions during the initial crawl. It serves as a heartbeat to confirm active progress.
Change rate is the number of user-driven changes, for example, edits, additions, and deletions synced in the past 24 hours after the initial crawl completes. It indicates ongoing freshness.
While some connectors (like GitHub) offer restriction configuration during setup through the UI, most connectors require Glean support assistance for implementing crawl restrictions. Available restriction methods include:
Time-based
Limit crawling to content created or accessed within a specific timeframe (for example, last 6 months)
User-based
Restrict crawling to content from specified users
Group-based
Limit crawling to content from specific AD groups
Site/Channel-based
Restrict crawling to specific sites or channels
Available restrictions depend on the connector's API capabilities. Most applications support both greenlisting (explicit inclusion) and redlisting (explicit exclusion).
If you encounter errors in your crawl status, this may indicate connectivity issues with your connector or problems with the data itself. We recommend:
- Verifying your connector configuration
- Contacting Glean support if issues persist
Yes, Glean fully supports concurrent crawling of multiple connectors.
The Job in progress status indicates an active crawl of your connector. Since full crawls typically take several days to complete, this status will persist throughout the crawling process.
To delete a connector after initial setup, navigate to the Connectors page on the admin console and click the connector instance you wish to delete. On the "Overview" tab, open the "Extreme Measures" section and click the "Delete instance" button.
Once you have confirmed the deletion, it may take up to 5 minutes for documents from this connector instance to no longer appear in Glean search results. All associated data will be removed in the background.
Currently, some connectors do not support deletion. Connectors that you cannot create multiple instances of cannot be deleted. In addition, you will not be able to delete your active People Connector. If you wish to delete this connector, first set a new People Connector on the People Data page.
Crawl management operations must be performed by Glean support. Please contact them for assistance with stopping or restarting crawls.
Glean removes deleted content from search results through two mechanisms:
- API and webhook deletion: For connectors that support deletion notifications (such as SharePoint, Google Drive, Box, Slack, and Confluence), Glean processes the deletion event and removes the content from the index. This typically happens within minutes to hours, depending on the connector.
- Full crawl cleanup: For connectors that don't provide deletion notifications, stale content is identified and removed during the next scheduled full crawl. Full crawl frequency varies by connector. See Refresh rates for details.
The timeline depends on the connector and how the deletion is detected:
- If the connector supports real-time or near-real-time deletion events (via APIs or webhooks), the content is typically removed within minutes to a few hours.
- If the deletion event is missed or the connector doesn't support deletion notifications, the content is removed during the next full crawl. Full crawl intervals range from 6 hours to 28 days depending on the connector.
For connector-specific deletion timelines, refer to the data refresh rates tables.
There are a few common reasons:
- Propagation delay: The deletion may not have been processed yet. Most connectors pick up deletions within minutes to hours, but there can be a short lag between when content is deleted at the source and when it's removed from Glean.
- Missed deletion event: In rare cases, the source application may not send a deletion notification to Glean. In these cases, the content is removed during the next full crawl.
- Recycle bin behavior: Some applications (like SharePoint) move deleted items to a recycle bin rather than permanently deleting them. Glean treats items in the recycle bin as deleted and removes them from search results during the next crawl cycle.
If a deleted document persists in search results longer than expected, contact Glean support. For urgent cases involving sensitive content, Glean support can remove specific items from the index immediately.
Yes. Admins can use the content hiding feature in the Admin console under Glean Protect to temporarily hide specific documents from search results. Navigate to Admin console > Glean Protect > Content hiding and use the CSV upload or document search to hide individual documents. See Managing result visibility for details.
You will see Crawl rate only during the initial crawl. After the initial crawl is complete, Change rate appears for that connector.
Approximately every 5–10 minutes.
This can mean the connector is being initialized or no crawling tasks were performed in the last hour, for example, due to health checks. If 0 persists longer than expected, investigate configuration and permissions.
Either no user‑driven changes occurred in the last 24 hours or updates are not being synced. If you expect activity, investigate potential sync or permission issues.
Certain connector types are excluded, for example, federated‑fetch only, customer‑managed, and web connectors.
Not necessarily. These metrics reflect activity, not a complete health assessment. Use them alongside status indicators and error surfacing.
-
Yes—conceptually, it's the count of document change events Glean processed in the last 24 hours for an ongoing crawl. These events include creates (adds), updates (content/metadata/permissions), moves/renames, and deletes. Think of it as an activity "heartbeat" showing that new or changed content is actively being processed.
-
In the original spec, the admin table highlights "added in the past day" as the simplest, user-friendly roll-up for ongoing crawls; internally, it's backed by the change-event stream described above.
-
Multiple changes to the same item: If one document is edited many times in a day, each edit is a separate change event. "Items synced" is a cumulative count of distinct items indexed, so it won't rise with repeated edits.
-
Updates and deletes don't increase "items synced": Edits and permission-only changes are counted in "Change rate" but do not add to the total items. Deletes can even decrease "items synced" while still incrementing the change count.
-
Timing and pipeline lag: "Items synced" is a lagging, cumulative indicator that updates after indexing completes; "Change rate" reflects event processing activity within the last 24 hours and can surface earlier in the pipeline. Over short windows, you may see a high change rate without a corresponding immediate increase in the items total.
-
Permission/metadata churn: Some connectors generate events for permission or metadata changes (for example, access list updates), which raise "Change rate" even when no new items are added to the index.
- A live "heartbeat" of connector activity: It shows whether the connector is actively processing new or changed content in the last 24 hours (creates, edits, permission/metadata changes, deletes), so you can quickly confirm the crawl isn't idle.
- Early stall detection: If Change rate flatlines while you expect activity, it's a signal to check connector health (auth scopes, webhook subscriptions, errors) even before the total items count moves.
- Interpreting gaps vs. Items synced: Because Items synced is a cumulative, lagging indicator, a high Change rate with little movement in Items synced can indicate many edits/deletes or permission-only changes (which don't add to the total).
- Validating configuration changes propagate: After updating inclusion/exclusion rules or visibility settings, a non-zero Change rate is a quick way to verify those changes are being picked up and applied by the pipeline.
- Spotting surges or operational events: Spikes can reflect bulk content uploads/migrations or large permission sweeps—useful operational context that can explain search result shifts or indexing load.
- Where it fits with Crawl rate: Use Change rate to monitor ongoing crawls; Crawl rate is the companion metric during initial syncs.
- Not exactly. For initial crawls, Crawl rate is the number of document parts discovered in the past hour. It's a throughput metric of the initial sync, reported in "parts," not a count of internal processing tasks, and it's not limited to permissions/metadata-only operations
- In the admin UI this shows up as a parts/processing rate during initial sync. Once a connector moves to ongoing crawls, this column switches to show Change rate instead.
-
A live initial‑sync heartbeat: If Crawl rate is non‑zero and changing, the initial crawl is progressing and discovering new parts; if it flatlines during initial sync, it suggests a stall that merits a health check.
-
Speed and time‑to‑completion context: Because Crawl rate is "parts discovered per hour," monitoring it alongside the initial crawl time estimate helps you gauge how quickly the initial sync will finish. The setup flow includes a "Get sync time estimate."
-
Interpreting vs. Items synced: Items synced is a cumulative, lagging count that updates after indexing completes. During initial sync, you may see Crawl rate activity without an immediate Items synced increase, especially when pipelines are still processing discovered parts.
-
When the metric changes: Remember that Crawl rate is shown for initial syncs; once the source transitions to ongoing syncs, the table shows Change rate as the ongoing "heartbeat."
For questions not addressed here or for specific crawl-related assistance, contact Glean Support.