Record a Trace/HAR file requests
When you experience performance issues, our engineering team may request a Chrome trace to diagnose and resolve the problem.
Chrome traces help our engineers understand exactly what's causing performance bottlenecks, allowing us to optimize the experience for you.
Privacy Considerations
Chrome traces may contain sensitive information including:
- URLs and titles of open tabs
- Running browser extensions
To protect your privacy, consider closing unnecessary tabs before recording. Note that traces do not include your browser history.
We recommend using the CloudFlare HAR File Sanitizer to remove any sensitive information from the trace file before sharing it with Glean.
Recording a Trace
Open Chrome Tracing
In a new Chrome tab, navigate to chrome://tracing
Initialize Recording
Click the Record button located in the upper left corner
Configure Settings
- Click Manually select settings
- In the Record categories section, click the All button in the left column
- Click Record to begin
Reproduce the Issue
Perform the tool that was experiencing slowness (such as executing a search or opening a new tab)
Save the Trace
- Return to the tracing tab
- Click Stop
- Click Save in the upper left corner
- Share the resulting trace file with our support team
Additional Settings
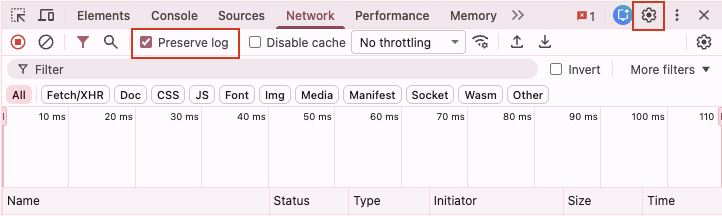
- Make sure you have checked the box to "Preserve log"
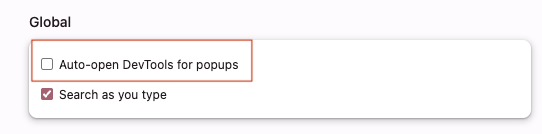
- Under the DevTools settings make sure to also check the "Auto-open DevTools for popups" as well
Before you send a HAR file to Zendesk
- Rename AND zip or compress your HAR files.
- Uncompressed HAR files are often over Zendesk attachment limits.
- By default, HAR files use the page URL as the name of the file.
- Files with .com extensions look suspicious to spam and phishing filters, give the HAR file a descriptive name that doesn't include their full URL.
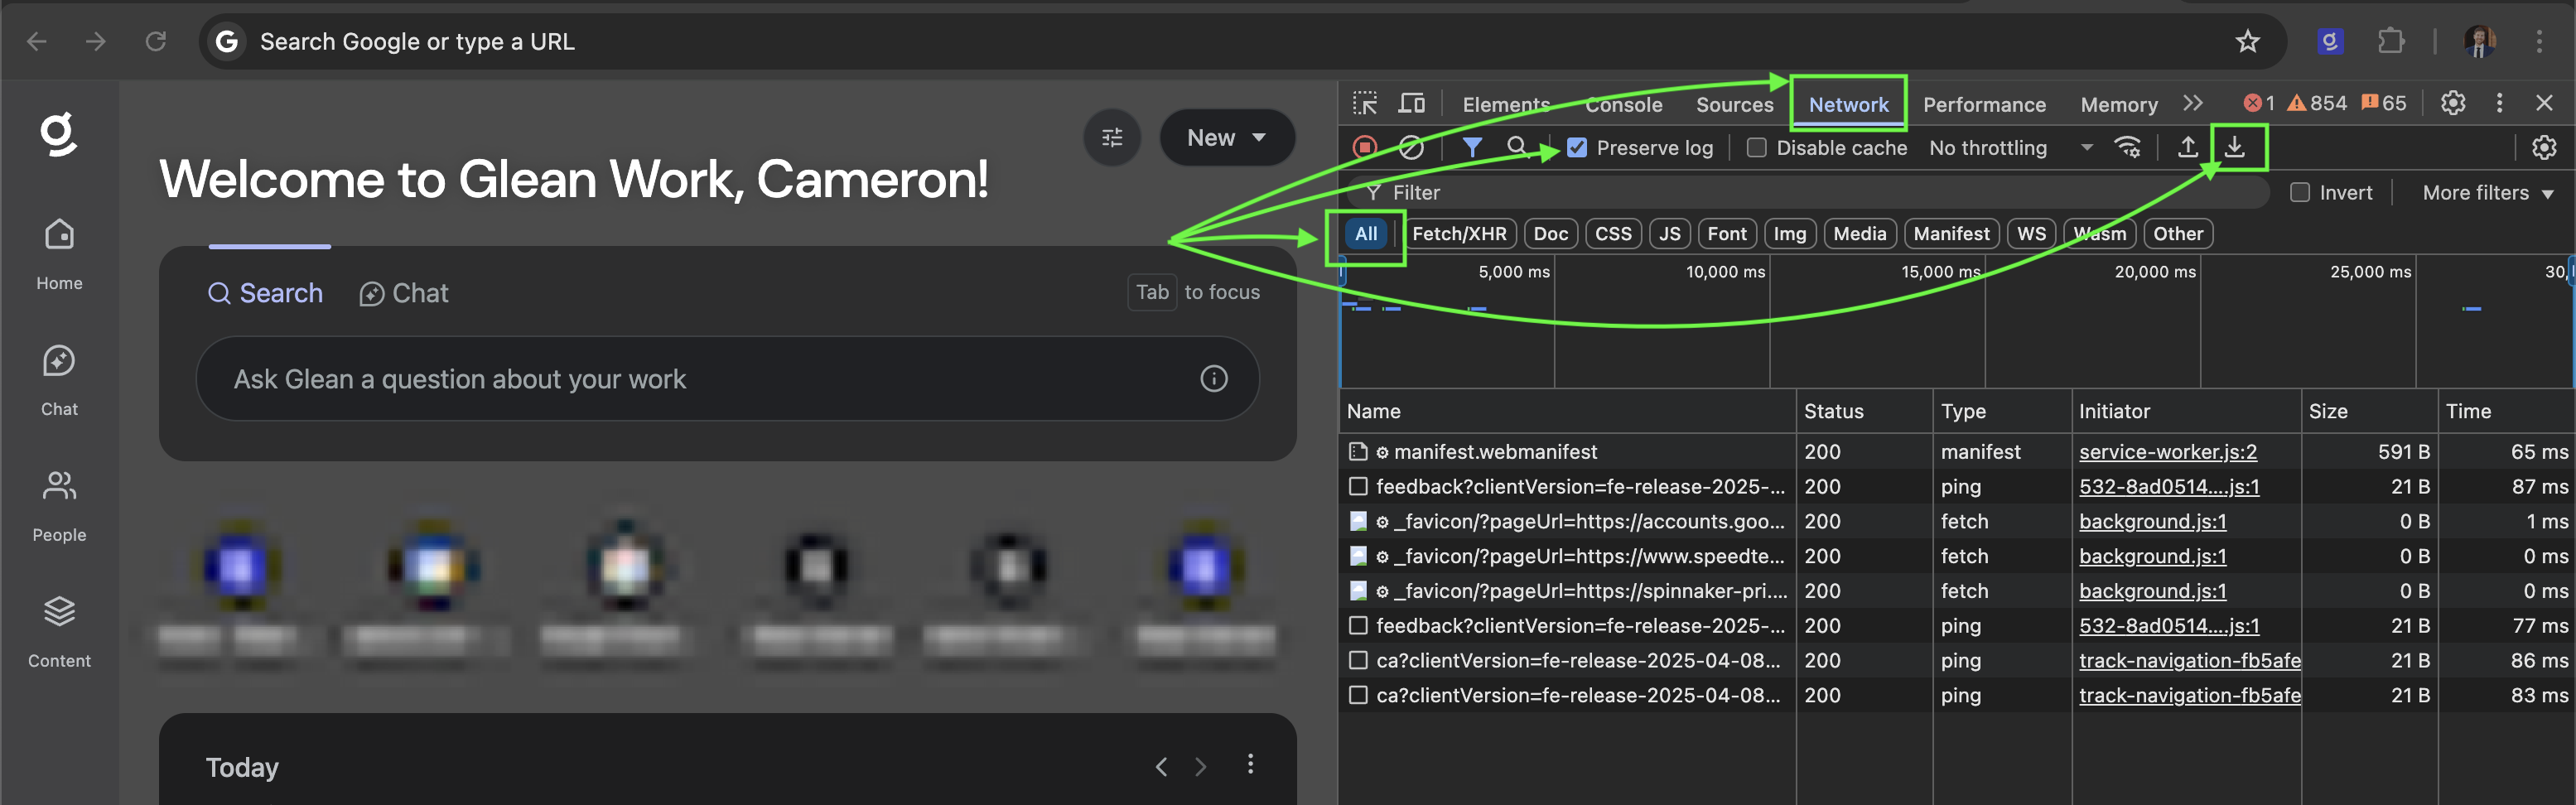
Don't Use Chrome or Above Steps Not Working?
If you are blocked from Chrome tracing (chrome://tracing) or Chrome is not your preferred browser, you can open the browser dev tools (cmd + opt +i , or right click + inspect) and follow the rest of the above steps from the network tab.