Agents insights
Glean collects analytical data regarding the usage and performance of Agents within Glean and displays it in the insights dashboard. This data includes metrics related to user engagement, agent effectiveness, and overall quality of interaction.
The Agents insights dashboard helps builders understand how a specific agent is being used, how users are responding to it, and where they may need to improve the experience.
Agents insights can help you in a few ways:
- Understand user engagement: The dashboard provide insights into how users interact with agents, including metrics like monthly active users and feedback rates.
- Measure impact: Insights can help you evaluate the effectiveness of your agents by measuring engagement levels.
- Continuous improvement: You can use this data to refine the agents you are creating to improve quality and user satisfaction.
- Data-driven decisions: Offers factual data that can drive decisions on resources allocation, feature enhancements, and prioritization of agents.
The per-agent insights page uses the same dashboard component as the org-wide admin page, but the view is more limited because it is scoped to a single agent.
Access Agents insights dashboard
To view insights for a specific agent:
- Open Agents in Glean.
- Open the agent you want to review.
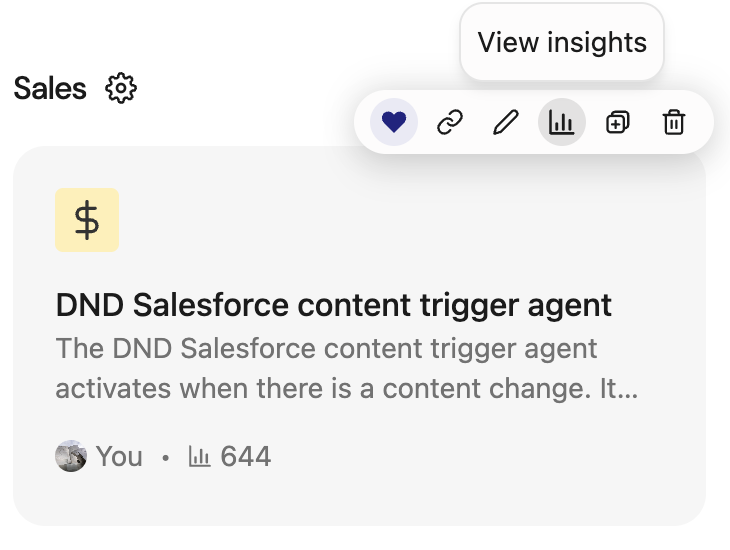
- Click View insights.
To return to the agent configuration from the insights view, click View agent setup.
Understand per-agent insights
The per-agent insights dashboard focuses exclusively on the performance of a single selected agent. Because of this narrower scope, the layout differs from the org-wide dashboard in the following ways:
- Hidden filters: The Department and Manager filters are unavailable.
- Hidden widgets: The Usage by department and Top agents tables are removed.
- Filtered data: The Top users table automatically excludes users who have zero runs for the selected agent.
Depending on your workspace configuration, some widgets may be further restricted or hidden by your administrator.
Per-agent insights dashboard
The per-agent insights dashboard features only the Time period filter bar at the top of the screen to control the data displayed across the entire dashboard.
When you apply or update this filter, all charts and tables automatically refresh to match your selection.
Some summary cards display cumulative data current as of yesterday. These cards are explicitly labeled in the UI and are not affected by changes to the Time period filter.
Dashboard layout order
The dashboard displays data in the following order:
Adoption summary cards
These cards display current adoption metrics to help you gauge overall engagement. Depending on your role and workspace configuration, the cards include:
- Monthly active agent users
- Weekly active agent users
Active users trend
The Active users trend chart displays daily, weekly, and monthly active user trends over time. Use this chart to monitor whether agent adoption is growing, stabilizing, or declining.
Agent runs
The Agent runs chart tracks total agent activity over time, displaying both daily and cumulative runs.
Activity is calculated based on the agent type:
- Conversational agents: Each user message counts as one run.
- Task-based or background agents: Each trigger counts as one run.
Top use cases
This widget is optional and must be enabled for your workspace.
The Top use cases table groups runs into inferred categories so you can understand what types of work agents are performing most frequently.
For each use case, the table displays:
- Use case: the category name
- Runs: total count
- Trend: direction of volume changes
- Departments: department associated with the agent
- Top agents: the primary agents handling this use case
Time saved by agents
The Time saved by agents table helps estimate the tangible value and efficiency your agents are creating. This table displays:
- Agent
- Runs
- Feedback users
- Minutes saved per run
- Total hours saved
Top agent users
The Top agent users table identifies your most highly engaged employees. This helps look for internal power users or advocates. This table displays:
- User
- Department
- Runs
Voting feedback
Admins and eligible viewers can review voting trends over time in Agents insights.
The Voting feedback chart tracks user upvotes and downvotes over your selected time period, allowing you to monitor sentiment and response quality. Use it to understand how users are responding to agent output and to spot changes in sentiment.
If voting feedback drilldown is enabled for your workspace, admins can open detailed feedback for a selected day. The detail view may include feedback metadata and trace-linked diagnostics, depending on the privacy configuration. Downvoted feedback also displays issue categories and sub-categories when provided, giving more structured insight into why users downvoted a response.
Runs by outcome
If the Agent Insights revamp is enabled for your workspace, the Runs by outcome chart appears after the Voting feedback chart.
The Runs by outcome chart categorizes agent performance over time into three statuses:
- Successful
- Failed
- Paused.
Use this chart to quickly determine whether a drop in usage stems from user adoption trends or underlying technical and product quality issues.
Working with tables
Tables in Agents insights dashboard support the following interactions:
- Pagination: Navigate through large result sets using page controls.
- CSV export: Export table data as a CSV file for offline analysis or reporting.
- Drill-in: Click a row to open a detailed view with additional context.
Optimize your agent
The data in Agent insights is most valuable when used to iterate the configuration of your agent. Follow these strategies to move from monitoring to optimization:
-
Increase reliability and success
If you notice a trend of Failed or Error outcomes:
- Review interaction traces: Click into specific runs to see exactly where the agent stalled.
- Refine instructions: Update the system prompt of the agent to handle edge cases or clarify ambiguous requests.
- Verify tool health: Ensure that any connected tools or APIs have the necessary permissions and are returning data correctly.
-
Align with user intent
Use the Top use cases data to ensure the agent is solving the right problems:
- Identify gaps: Look for common topics that have high volume but low upvote rates. This suggests the agent is being asked for help it is not yet equipped to provide.
- Expand capabilities: Use Top use cases data to justify building new workflows or adding additional connectors to the knowledge base of the agent.
-
Measure reach and retention
Analyze the Active users trend tab to understand the how well the agent is doing within your organization:
- Evaluate depth: High repeat-usage indicates the agent has become a core part of the workflow of a user.
- Analyze reach: If usage is concentrated in one department, consider adjusting the visibility settings or description of the agent to encourage adoption by other teams.
Feedback and privacy
Glean balances the need for diagnostic insights with strict user privacy standards. Depending on your workspace configuration, the following protections may apply:
- Feedback-based diagnostics: When enabled, builders can view user-submitted feedback to troubleshoot specific interactions.
- Anonymization: Glean may aggregate or anonymize sensitive data points to prevent the identification of individual users while still providing meaningful trends.
- User transparency: If feedback data is visible to builders, users see a disclosure message in-product explaining how their input is used to improve the agent. For more information, see How feedback data is used in Agent Insights.
Admins and users with the insights moderator role can view insights for all agents. This page provides a focused view of usage, engagement, and feedback for a specific agent, while the organization-level Agent Insights page provides a broader view across all agents in your organization.
Totals in the insights view for a specific agent might not exactly match the numbers shown on the organization-level Agent Insights dashboard.
The organization-level dashboard shows aggregate totals for the selected time period. In the insights view for a specific agent, the user breakdown is not a full accounting of every user included in that total.
Because these views present data differently, the numbers might not match exactly. This difference is expected and does not indicate missing usage data.