Agents insights
Agents insights dashboard helps admins and insights moderators understand how widely agents are being adopted and how the agents are used across your organization. This view helps understand usage patterns, identify power users, and guide adoption efforts.
Access Agents insights
Prerequisites
To access Agents insights, you must have one of the following roles:
- Glean admin
- Insights moderator
Open Agents insights dashboard
- Open Glean.
- In the left navigation menu, select Insights.
- Open Agents.
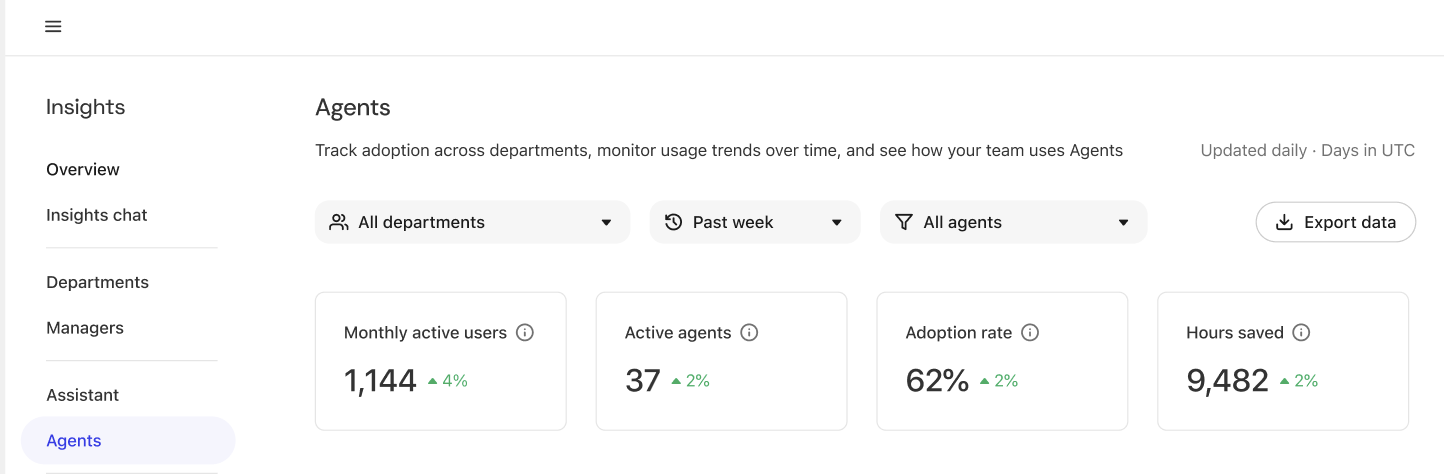
Agents insights dashboard
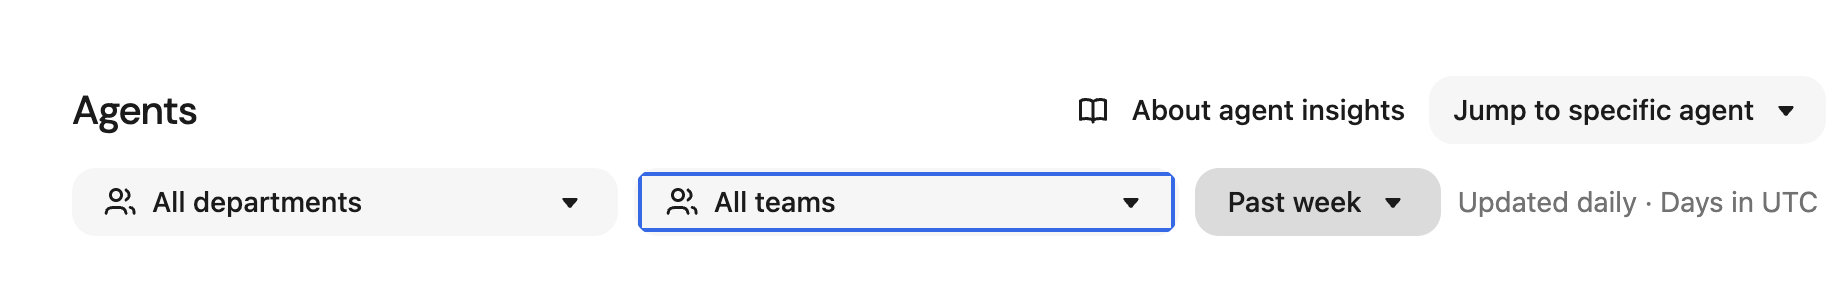
The Agents insights dashboard features a global filter bar at the top of the screen to control the data displayed across the entire dashboard.
You can filter insights by using the following filters:
- Time period
- Agent
- Department
- Manager
When you apply or update a filter, all charts and tables automatically refresh to match your selection.
Some summary cards display cumulative data current as of yesterday. These cards are explicitly labeled in the UI and are not affected by changes to the Time period filter.
Dashboard layout order
The dashboard displays data in the following order:
Adoption summary cards
These cards display current adoption metrics to help you gauge overall engagement. Depending on your role and workspace configuration, the cards include:
- Monthly active agent users
- Weekly active agent users
- Agents shared across your organization: For administrators, this card counts published, shared agents and excludes drafts or agents visible only to their owner.
Active users trend
The Active users trend chart displays daily, weekly, and monthly active user trends over time. Use this chart to monitor whether agent adoption is growing, stabilizing, or declining.
Agent runs
The Agent runs chart tracks total agent activity over time, displaying both daily and cumulative runs.
Activity is calculated based on the agent type:
- Conversational agents: Each user message counts as one run.
- Task-based or background agents: Each trigger counts as one run.
Top use cases
This widget is optional and must be enabled for your workspace.
The Top use cases table groups runs into inferred categories so you can understand what types of work agents are performing most frequently.
For each use case, the table displays:
- Use case: the category name
- Runs: total count
- Trend: direction of volume changes
- Departments: department associated with the agent
- Top agents: the primary agents handling this use case
Top use cases is currently available for GCP customers.
If your organization uses AWS, workflows might appear as UNKNOWN until taxonomy support is added for AWS.
Time saved
This widget is optional and must be enabled for your workspace.
The Time saved table helps estimate the tangible value and efficiency your agents are creating. This table displays:
- Agent
- Runs
- Minutes saved per run
- Total hours saved
Agent usage by department
The Agent usage by department table shows which teams are interacting with agents most heavily during the selected time period.
Top agents
The Top agents table helps you identify which specific agents are driving the highest usage across the organization. This table displays:
- Agent
- Users (unique count)
- Runs
- Creator
Admin view only: This section appears exclusively on the org-wide dashboard and is hidden on individual per-agent insights pages.
Top users
The Top users table identifies your most highly engaged employees. This helps look for internal power users or advocates. This table displays:
- User
- Department
- Runs
- Agents used
- Average runs per day
- Agents created
Voting feedback
The Voting feedback chart tracks user upvotes and downvotes over your selected time period, allowing you to monitor sentiment and response quality. Use it to understand how users are responding to agent output and to spot changes in sentiment.
If voting feedback drilldown is enabled for your workspace, admins can open detailed feedback for a selected day. The detail view may include feedback metadata and trace-linked diagnostics, depending on the privacy configuration.
Runs by outcome
If the Agent Insights revamp is enabled for your workspace, the Runs by outcome chart appears after the Voting feedback chart.
The Runs by outcome chart categorizes agent performance over time into three statuses:
- Successful
- Failed
- Paused.
Use this chart to quickly determine whether a drop in usage stems from user adoption trends or underlying technical and product quality issues.
Data freshness and retention
Usage data is available up to and including yesterday (in UTC). Insights data is only guaranteed for the last 270 days.
Interacting with tables and exporting data
Most tables within Agent Insights support common data management actions. Depending on your workspace configuration, you can use the following features:
- Pagination: Navigate through large datasets seamlessly.
- CSV export: Download table data for external analysis and reporting.
- Drill-in behavior: Click rows to open deeper contextual metrics and data views.
Troubleshooting
Agent Insights data is empty
If the Agent Insights tab shows no data, check the following:
- No qualifying activity: Agent Insights require at least one agent run in the selected time period. Adjust the time period filter and confirm that agents have been run in your organization.
- Insufficient permissions: You must be an admin or have the Insights Moderator role. Contact a Super Admin to verify your role.
- Data processing delay: Insights data is computed daily. If agents were run recently, wait until the next day for data to appear.
- Persistent empty data: If the time period and permissions are correct and data is still missing, file a ticket with Glean Support.