Admin Notifications Dashboard
The Admin Console Dashboard includes a Notifications panel that surfaces issues and system messages that require admin attention. This panel provides a centralized view for connector health problems and high-priority alerts. Admins can identify broken or at-risk components immediately upon opening the console.
The Notifications panel empowers admins by providing immediate clarity and control over connector health. This feature directly addresses the following challenges:
- Verified readiness: Admins now receive clear indicators when a new connector is ready for testing in search and chat, eliminating guesswork after initial connection.
- Proactive health monitoring: Instead of silent failures, Glean surfaces real-time status updates and prescriptive troubleshooting steps. This allows admins to resolve issues independently and quickly.
This streamlined communication reduces reliance on manual support and ensures your Glean deployment remains healthy and high-performing.
Notifications
The Notifications panel appears below the page title and description. Each row represents a single notification. Glean groups these in a scrollable list ordered by recency.
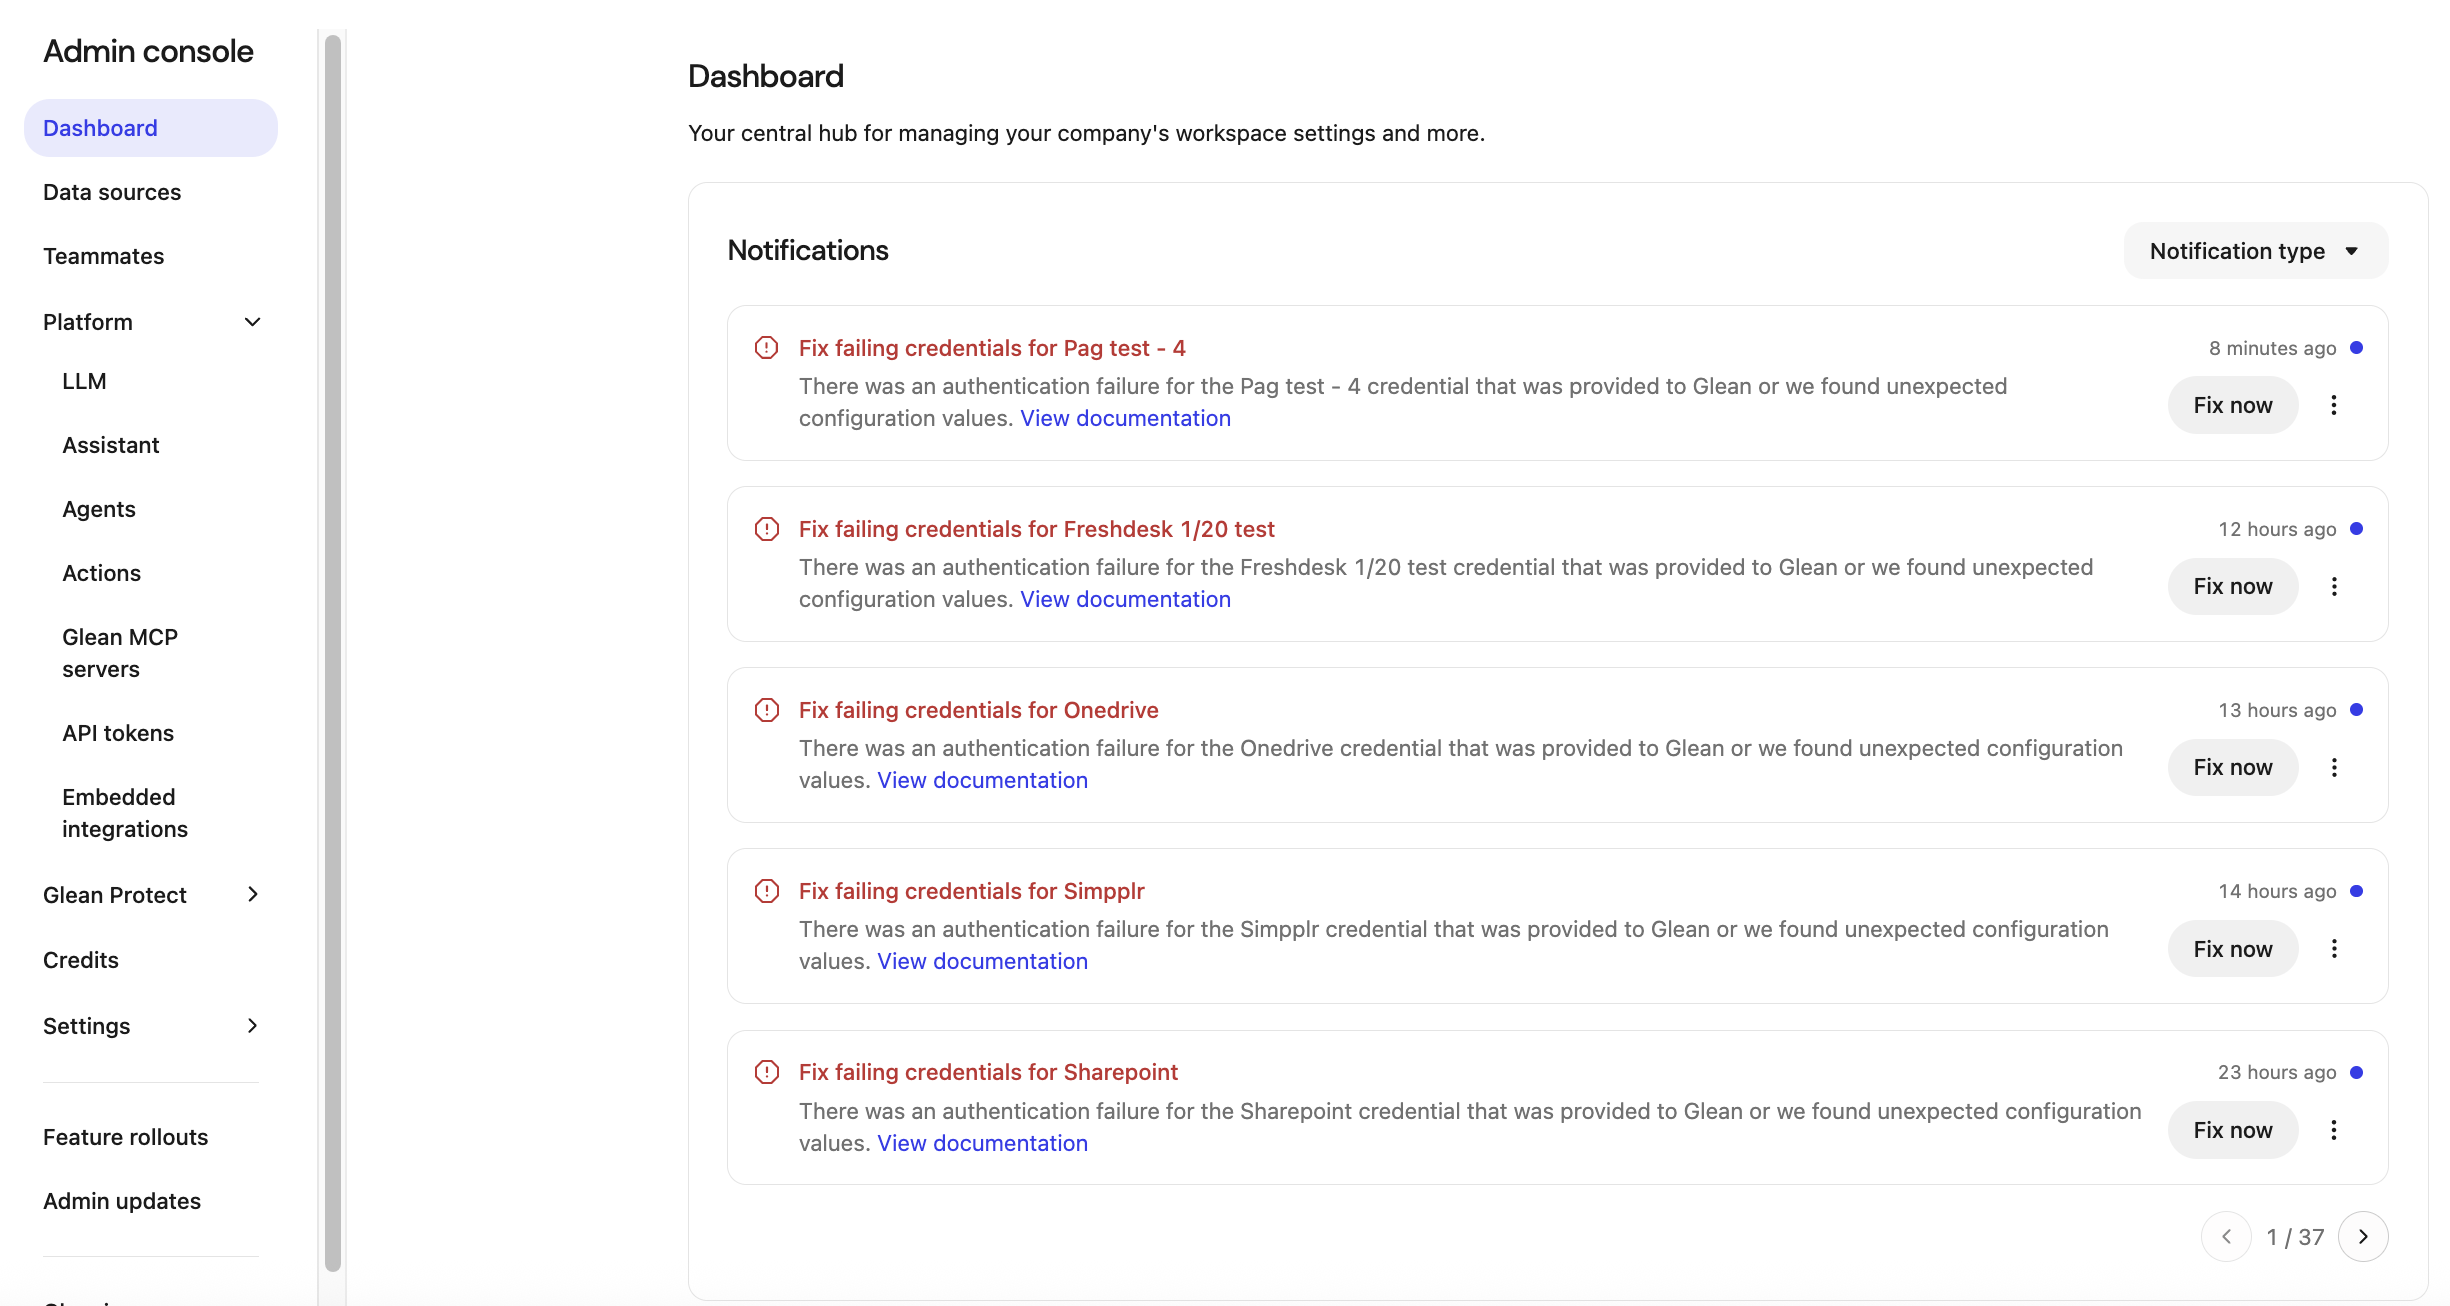
Figure 1: Dashboard view with credential alerts.
Notification components
Each notification card provides a concise and actionable summary:
- Title: Summarizes the issue, such as
Failing credentials: SlackorFailing credentials: Freshdesk. - Description: Explains the error and its impact, such as degraded search results due to access failures.
- Recommended tool: Instructs the admin to review failed checks and follow the linked documentation.
- Status and recency: Indicates how long ago the issue occurred and includes an unread indicator blue color dot for new items.
- Fix issues: Provides a Fix now button that navigates directly to the affected connector or configuration page.
- Overflow menu: Allows the admin to Mark as unread or Delete the notification.
Filter notifications by severity
The Notification type menu allows you to filter the list by severity. You can toggle the following categories independently:
- Critical: Focuses on alerts that directly affect data freshness, search completeness, or core system health.
- Warning: Surfaces urgent issues that do not yet break core functionality.
- Info: Displays informational updates or low-priority system messages.
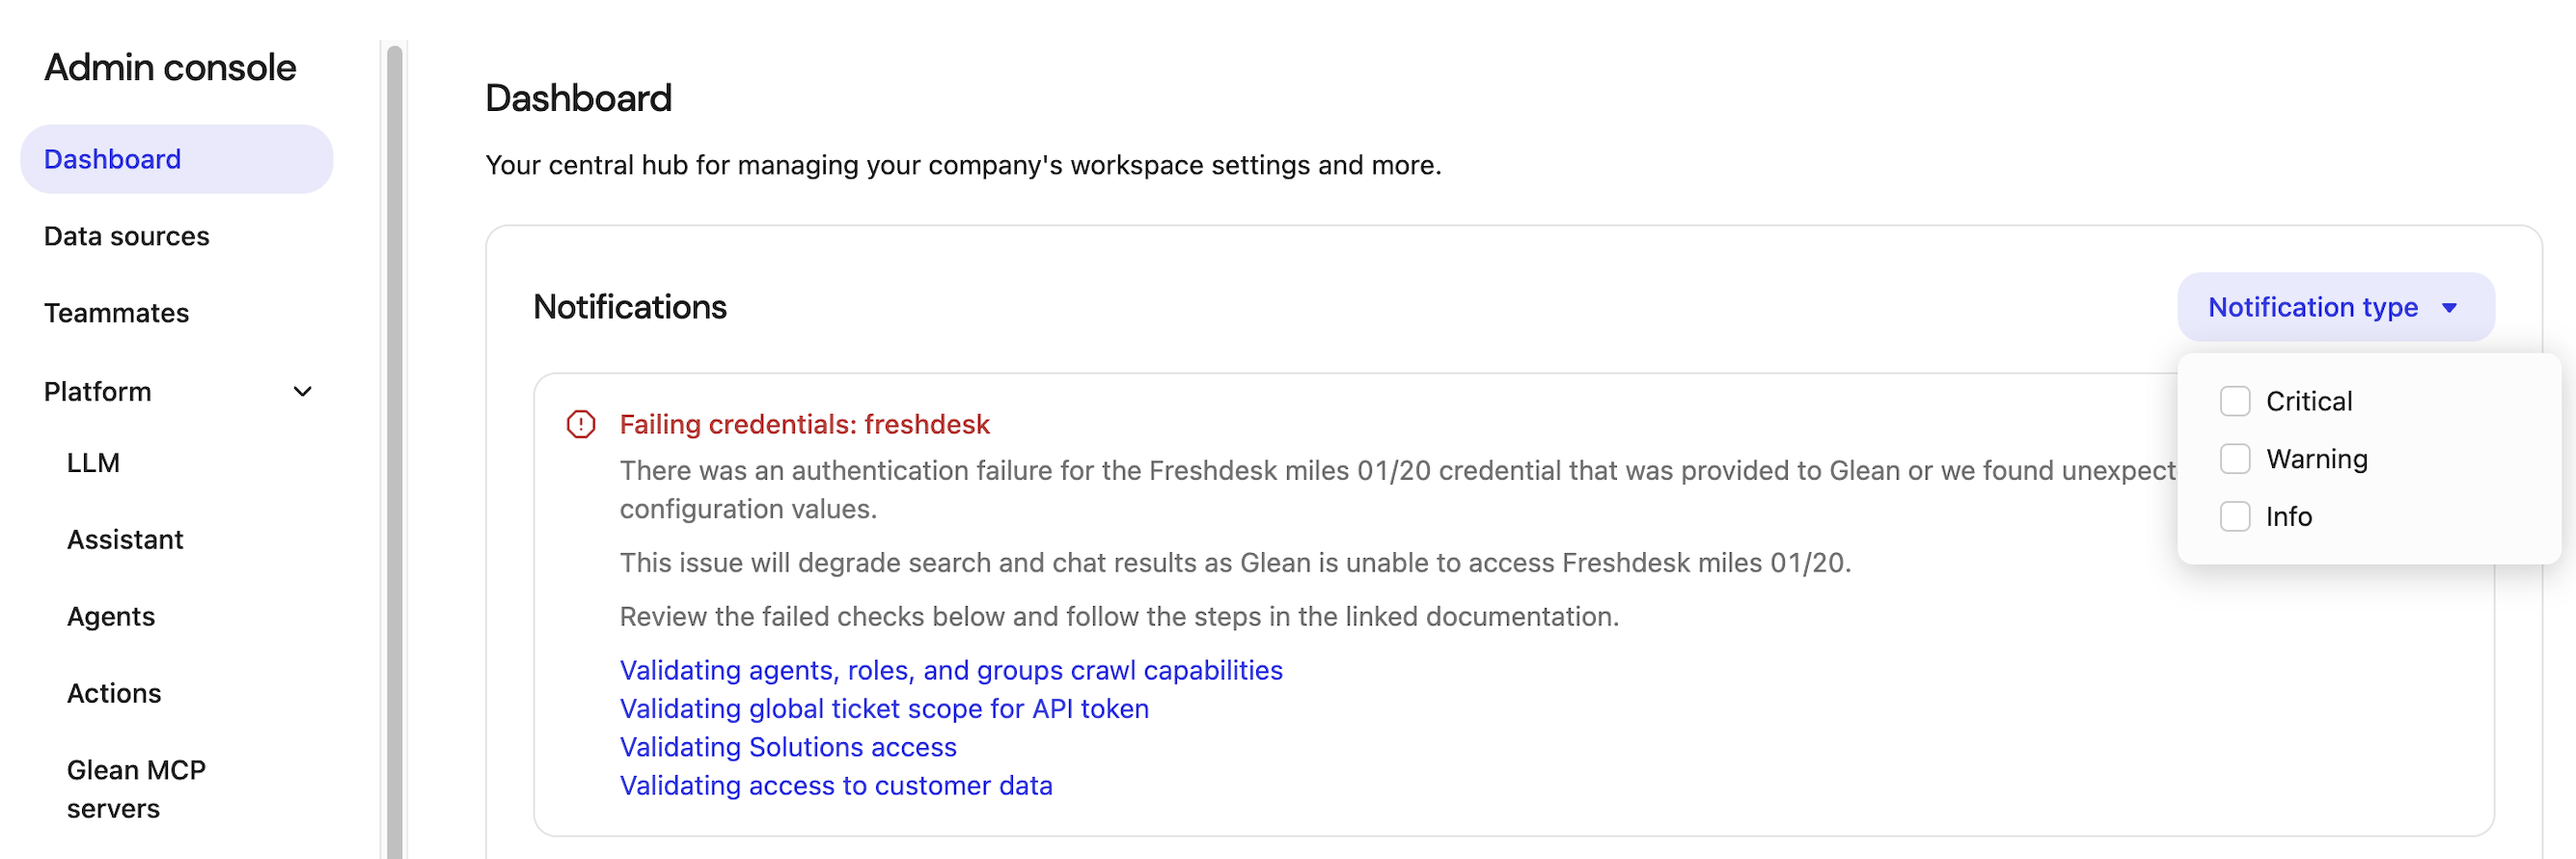
Figure 2: Severity filter options.
How Dashboard notifications relate to Alerts
Dashboard notifications are powered by the same health checks and alerting framework that drives email‑based admin alerts and the Alerts settings page.
Conceptually:
- The Dashboard Notifications panel is the in‑product view: a live list of active issues that impact search quality, data freshness, or connector health.
- The Alerts page (Admin Console → Notifications → Alerts) is where admins configure recipients and behavior for email‑based alerts.
- Email alerts remain the push channel; Dashboard notifications are the always‑available, pull‑based view when an admin is already in the console.
If a connector credentials check fails, admins can expect:
- A notification card on the Dashboard that summarizes the failing connector and links to the relevant troubleshooting article.
- An email alert (depending on alert configuration) sent to the recipients defined under Alerts.
Admin notifications are designed to be the first place admins look when they want to understand the current health of their deployment and quickly drill into the highest‑impact issues.
For more information on alerts, see About Admin Alerts.